by Richard Stone
A survey of business leaders’ salaries have revealed recent increases of double the rate of inflation. Those concerned, however, have continued to campaign against increasing wage rates for their workforces even to much lower percentages. The contradictory behaviour is symptomatic of a power relationship based upon rampant exploitation by the business-classes, with double standards and rigged rules, devoid of any moral or ethical considerations for anyone else but themselves.
Economic rationalism, furthermore, has increased the exploitative relationship to new heights, with massive accumulation of wealth, which clearly does not trickle down to lower socio-economic groups.
In mid-June the Governance Institute of Australia issued their latest Board and Executive Remuneration Report, with details of how base salaries for managing directors had increased by an average of 14 per cent while CEO salaries had risen by 15 per cent. (1) The comprehensive survey, conducted in conjunction with McGuirk Management Consultants, included findings from 1167 boards in the public, private and not-for-proft sectors, including 226 listed companies. (2)
The study also found managing directors of 200 ASX-listed companies had recorded an average of 19 per cent salary increases. (3) The large salary increases, however, form only part of the economic relationship: 52 per cent of listed managing directors were also shown eligible for performance bonuses, with an average maximum bonus paid of 89 per cent. (4)
Of listed CEOs, a total of 51 per cent were eligible for performance bonuses, with an average maximum of 72 per cent. (6)
The fact the average fixed remuneration of an ASX-listed managing director is $1.58 million, clearly shows a massive discrepancy in spending power when compared with lower socio-economic groups. (7) The snouts of the top end of town were clearly in the trough.
While Governance Institute chief executive Megan Motto stated the large salary increases were ‘an indication that a tight labour market and the rising cost of living was playing out at the executive level’, those who benefited from the salary increases have tended to show little regard for lower socio-economic groups experiencing the same problem. (8) In fact, many have openly advocated small wage increases for workforces not even in line with CPI, despite drastically reduced living standards for lower socio-economic groups.
CPI, furthermore, is only part of the economic landscape, and not particularly accurate.
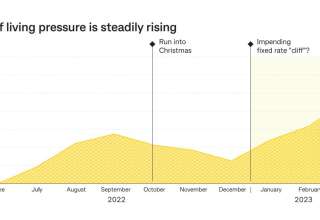
A recent study, for example, found employees were experiencing a 9.6 per cent percentage change in the lost of living. (9) The CPI, however, has remained at around 7 per cent, not accounting for interest rate increases and other criteria. (8) Food prices, meanwhile, have increased by 9.2 per cent, bread by 13.4 per cent, imported oils and fats by 20 per cent, electricity by 12 per cent, travel by 20 per cent. (10)
For the record, recent studies have concluded the average weekly wage in Australia currently stands at $1,376.60 per week, and $71,585.20 per year, with the new basic minimum wage recently being increased by Fair Work Australia to $882.80 per week. (11)
Lower socio-economic groups are likely to spend far more of their disposable income on basic essentials than higher socio-economic groups. The cost-of-living is a decisive factor.
The exploitative relationship between owners of businesses, their managers and workforces takes place within an environment shaped by the rich and powerful. They have made the most of the rules for self benefit. Government departments, for example, frequently turn a blind eye to wage theft, unless prompted by trade unions to take the required action against employers. They have no wish to upset the business-classes, and fear their reaction.
Recent economic trends have also taken place amid a flood of business investment into Australia, showing returns remain sound. (12) Spending on equipment, plants and machinery, for example, has increased by 3.7 per cent to $17.1 billion, the largest increase in over two years. (13)
And at the top end of town, global wealth has continued to grow: reports from banking and financial institutions have revealed aggregate global wealth grew 12.7 per cent in 2021, despite the pandemic. (14) It was noted that it was ‘the fastest annual rate ever recorded’. (15) In 2020, the richest one per cent of the world’s population took two-thirds of the $42 trillion in new wealth, the remaining 99 per cent were left with the remainder; during the previous decade the richest one per cent and the other 99 per cent each acquired about half of all new wealth, pointing to the fact that inequality and the rate of inequality are both increasing. (16)
While higher socio-economic groups monopolised the massive accumulation of wealth, none of it trickled down to the working class, who have experienced a rapid decline in their living standards. The trickle-down effect, incidentally, was always the claim of the advocates of economic rationalism, who used it to publicise their model for economic development. The opposite took place: 131 billionaires doubled their wealth during the pandemic. (17) But then, that is what double standards and rigged rules are about.
The fact many of the higher socio-economic groups which reside in Australia do not pay income tax also remains, furthermore, a matter of serious contention.
1. Chief executives pocket an average 15 pc pay rise,
The Australian, 14 June 2023.
2. CEOs in clover as pay soars by 15 pc.,
The Australian, 14 June 2023.
3. Chief executives, Australian, op.cit., 14 June 2023.
4. CEOs in clover, Australian, op.cit., 14 June 2023.
5. Ibid.
6. Ibid.
7. Chief executives, Australian, op.cit., 14 June 2023.
8. Cost-of-living crunch, chart,
Interest rates rises fuel cost-of-living crisis,
The Australian, 4 May 2023.
9. Ibid.
10. Average Weekly Wage – Australian Bureau of Statistics, 23 February 2023.
11. Thinking about retirement? Rampant inflation means you’ll need a bigger nest egg,
The Australian, 21 March 2023.
12. See: Business investment jumps in early-2023,
The Australian, 2 June 2023.
13. Ibid.
14. See: Global Wealth Report, 2022,
Credit Suisse, and,
Global Wealth Report, 2022,
The World Bank.
15. World Bank, ibid.
16. See: Survival of the Richest, Oxfam publication, 2020.
17. See: Bloomberg Billionaires Index.


